Gantt timelines are here 💫

Gantt charts are now available on Height.
Gantt charts give you a clear timeline of work to be done, making it easy to spot inefficiencies and timing issues that would otherwise cause delays.
We’ve designed our Gantt charts to not only make it easy to see if a project is at risk of slipping, but also to make it super simple to make any changes needed to keep work on track.
Here are a few of our favorite Height Gantt chart features:
- Manage projects inline: add and adjust task dates all in the same view
- Subtask management: easily create and update subtasks when you spot potential inefficiencies in your plan
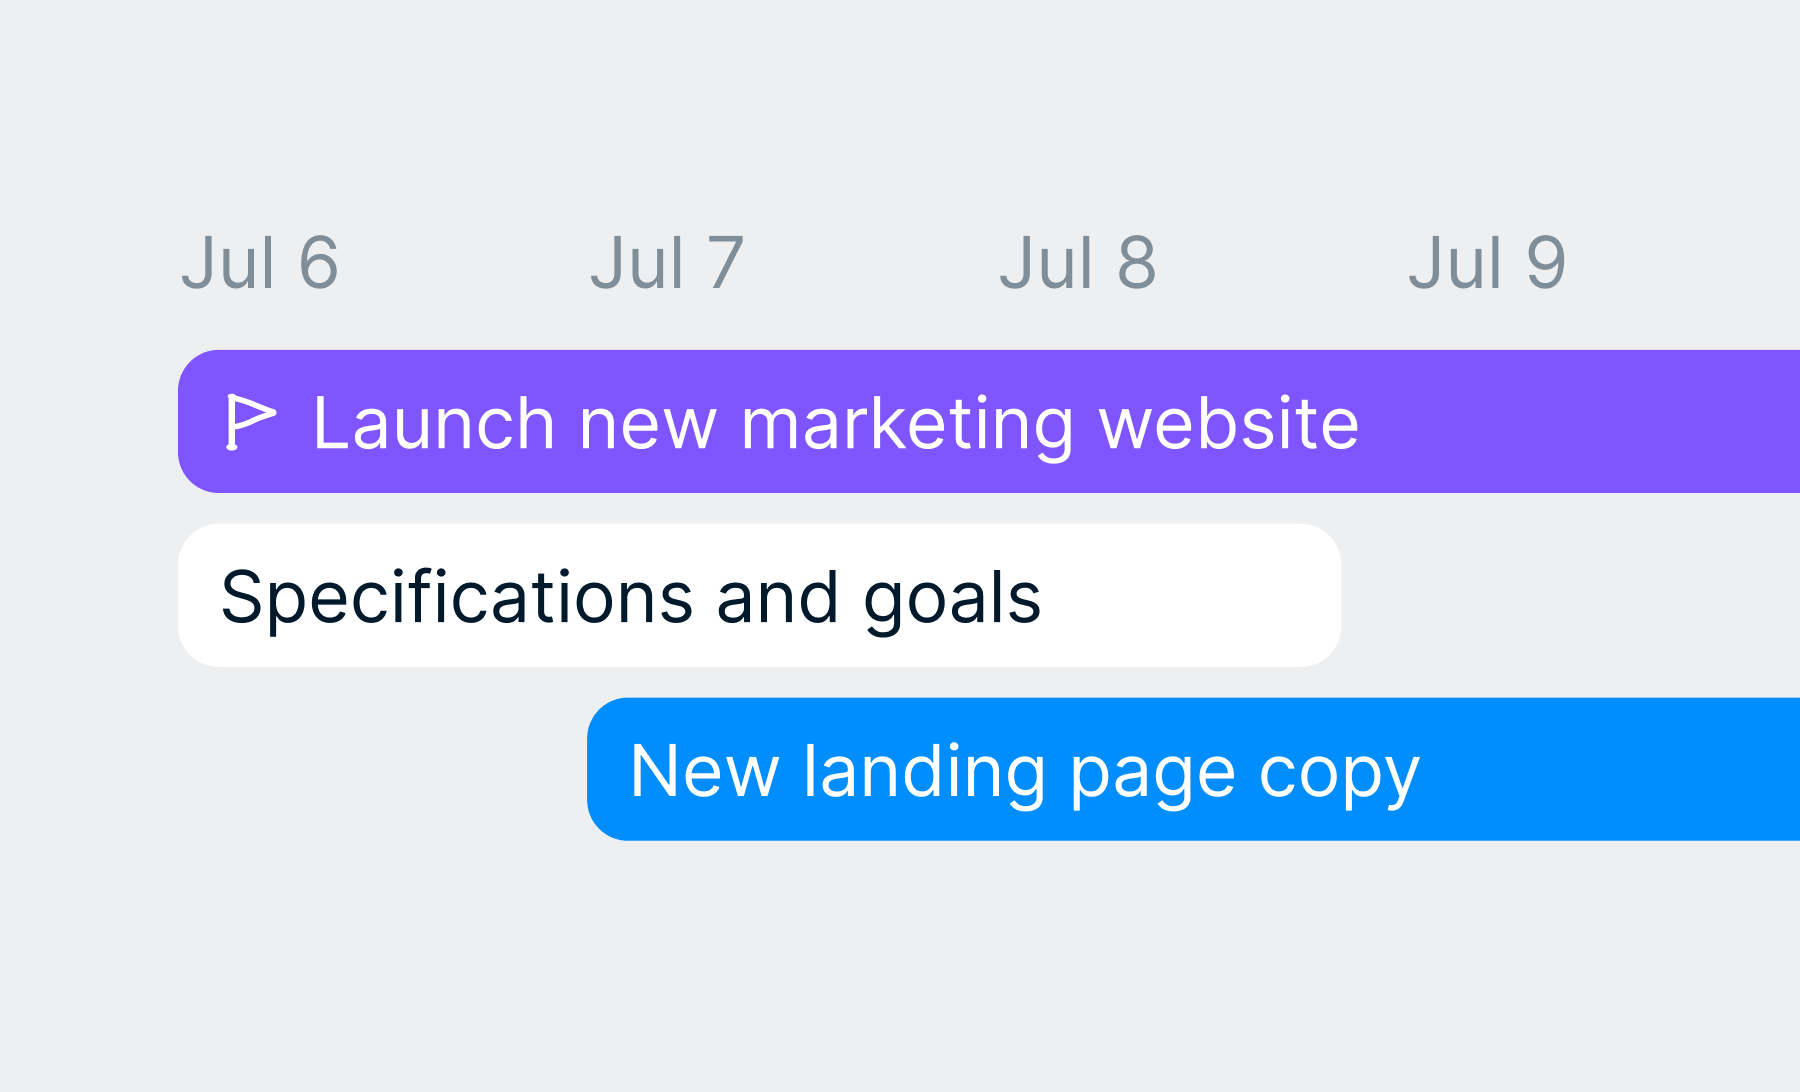
- Colors and icons: share an overview of the project with key stakeholders and differentiate tasks or team responsibilities with multiple icon and color options 🎨
- Fine-grained time scale control: zoom in to a day-by-day project view or zoom out to a quarterly roadmap with our highly flexible time scales
- Custom date attributes: use our default Start and Due dates, or select your own to configure your Gantt charts just how you want them
- Section & sort: dependency-tracking has never been so easy with powerful Section by and Sort by features to see tasks by Status or Assignees
Gantt is perfect for projects with deadlines and many moving parts, and we hope you love our take on Gantt charts as much as we do!
To switch a list to a Gantt visualization, go to View → Visualization from the list toolbar (or just hit Cmd+K → visualization).